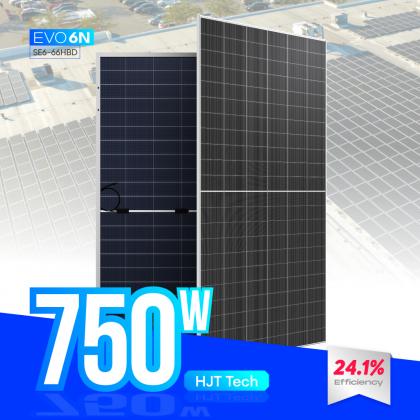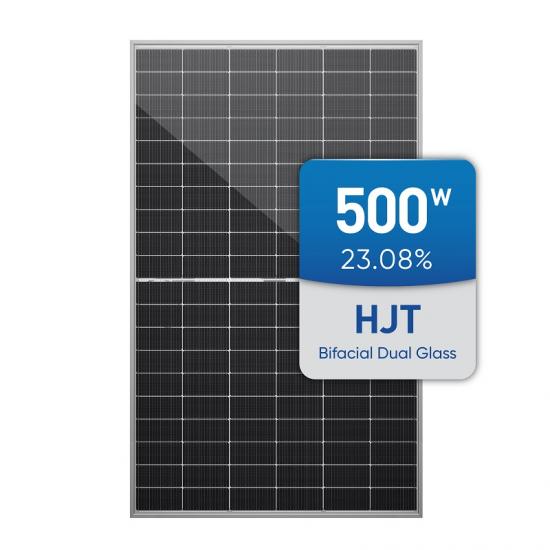
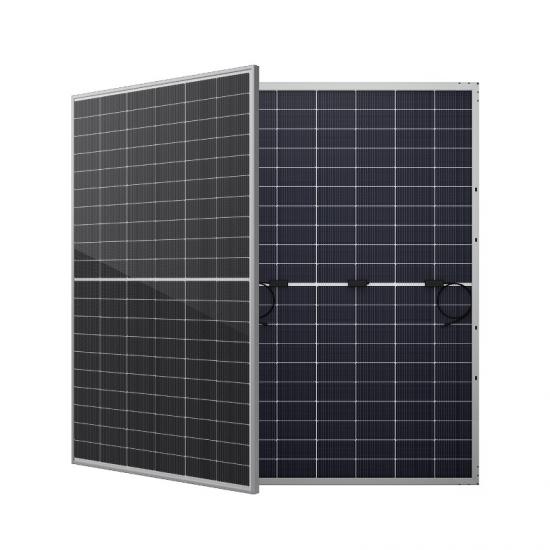
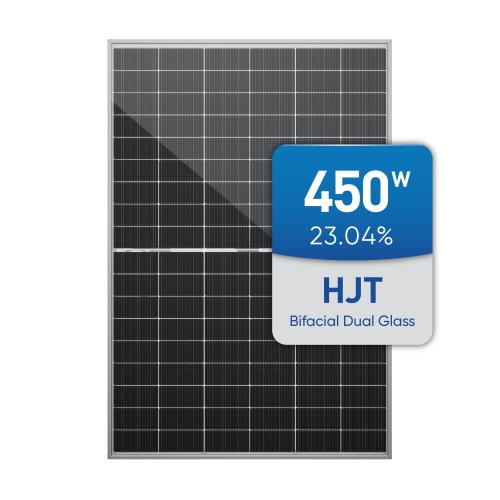
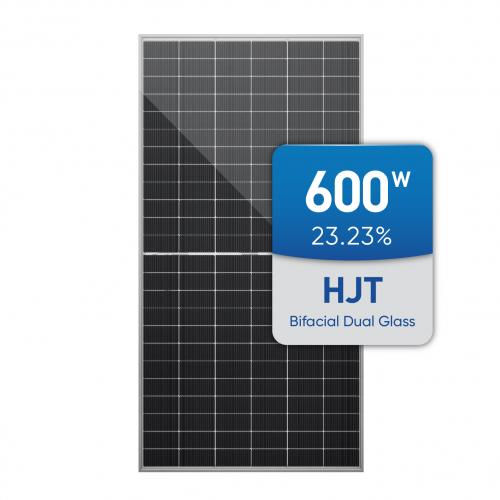
EVO 5N Series Bifacial modules combine combining gettering process and single-side μc-Si technology to ensure higher cell efficiency and higher module power. More stable power generation performance and is even better in hot climates. Natural symmetrical bifacial structure brings more energy yield from the backside.
Brand:
SunEvoPower Range:
480W~500WMax. Efficiency:
23.08%Number of Cells:
120 (6×20)Dimensions of Module L*W*H:
1910 x 1134 x 30mmWeight:
26.0kgsFront Side Glass:
2.0mm coated semi-tempered glassBack Side Glass:
2.0mm semi-tempered glassFrame:
Anodized aluminium alloyJunction Box:
Ip68 rated (3 bypass diodes)Cable:
4mm² , 300mm (+) / 300mm (-), Length can be customizedWind/Snow Load:
5400PaConnector:
MC4 compatibleBifaciality:
80±5%EVO 5N N-type HJT 120 Half Cells 480W 485W 490W 495W 500W Bifacial Dual Glass Solar Module
EVO 5N Series Bifacial modules combine combining gettering process and single-side μc-Si technology to ensure higher cell efficiency and higher module power. More stable power generation performance and is even better in hot climates. Natural symmetrical bifacial structure brings more energy yield from the backside.

Electrical Parameters (STC*)
|
Maximum Power (Pmax/W) |
480 |
485 |
490 |
495 |
500 |
|
Maximum Power Voltage (Vmp/V) |
37.50 |
37.68 |
37.85 |
38.03 |
38.20 |
|
Maximum Power Current (Imp/A) |
12.80 |
12.87 |
12.95 |
13.02 |
13.09 |
|
Open Circuit Voltage (Voc/V) |
44.93 |
45.10 |
45.26 |
45.42 |
45.58 |
|
Short Circuit Current (Isc/A) |
11.13 |
11.17 |
11.21 |
11.25 |
11.29 |
|
Module Efficiency (%) |
22.16 |
22.39 |
22.62 |
22.85 |
23.08 |
|
Power Output Tolerance (W) |
0/+5W |
||||
|
Temperature Coefficient of Isc |
+0.040%/°C |
||||
|
Temperature Coefficient of Voc |
-0.240%/°C |
||||
|
Temperature Coefficient of Pmax |
-0.260%/°C |
||||
| 5% | Maximum Power (Pmax/W) | 530 | 536 | 541 | 547 | 553 |
| Module Efficiency STC(%) | 23.27 | 23.51 | 23.75 | 24.00 | 24.24 | |
| 15% | Maximum Power (Pmax/W) | 552 | 558 | 564 | 569 | 575 |
| Module Efficiency STC(%) | 25.49 | 25.75 | 26.02 | 26.28 | 26.55 | |
| 25% | Maximum Power (Pmax/W) | 600 | 606 | 613 | 619 | 625 |
| Module Efficiency STC(%) | 27.70 | 27.99 | 28.28 | 28.57 | 28.86 |
So far, there are 3 technical routes, PERC battery is the most mainstream technical route accounting for 90% or more, and TOPCon and HJT are both on the rise.
Maximum Theoretical Efficiency:
PERC battery is 24.5%; TOPCon is divided into two types, one is single-sided (only the back surface is made of polysilicon passivation) 27.1%, double-sided TOPCon (the front surface is also made of polysilicon) 28.7%; HJT double-sided 28.5%.
Maximum Laboratory Efficiency:
PERC is 24%; TOPCon is 26%, which is the record of a laboratory with a small area of 4 cm in Germany. From a large area, the highest commercialization efficiency of Jinko is 25.4%; HJT is LONGi M6 commercialization reached 26.3%.
Nominal Efficiency of the Production Line (for the production line's own publicity report, some factors may not be considered):
PERC is 23%; TOPCon is 24.5%; HJT is 24.5%. According to the power of components in the market, sometimes it is said that the test efficiency is very high, but the power of the components is not very high. One possibility is that the CTM is low and the efficiency is falsely high. If we infer the battery efficiency from CTM=100% and look at 72 pieces of M6 batteries, silicon wafers of different sizes are not the same, PERC is 22.8%, TOPCon is 23.71%, and HJT is 24.06%. In fact, it really reflects the reality from the component side observation efficiency.
Production Line Yield:
The rate for TOPCon is 98.5%, and the difference in the broadcasts of various companies is relatively large, ranging from 90-95%; HJT is about 98%.
Process Quantity:
PERC has 11 processes; TOPCon has 12 processes; HJT has 7 processes, and conventionally has 5 processes. If it is done well, plus pre-cleaning and gettering, it will be 7 processes.
Sheet Suitability:
PERC is 160-180μm, and large-size silicon wafers are 182/210 or 170-180μm. The small size can reach 160μm; TOPCon is very similar to PERC, 160-180μm; HJT has applied 150 μm on a large scale, and it is no problem to achieve 130 μm. Some companies have announced 120 μm. Although the challenge is relatively large, the manipulator will adapt after improvement in the future.
Wafer size:
All are full size, just according to the market demand. It is very difficult for TOPCon to achieve 210 because there are too many high-temperature processes.
Compatibility:
The compatibility between TOPCon and PERC is mainly compatible, that is, adding two or three devices. HJT is basically incompatible.
Equipment Investment:
PERC is RMB 180 million/GW, TOPCon is RMB 250 million/GW, and HJT is RMB 350 million/GW.
Component Price:
PERC on the market is based on 100%, TOPCon has a 5% premium, and HJT has a 10% premium.
Technical Scalability:
At the present stage, double-sided PERC and TOPCon can be industrialized on single-sided. We follow the strict CTM100, mainly between 23.7% and 24%; The mass production of double-sided amorphous HJT is 24.3%, and the reverse equivalent efficiency is about 24%. In the next stage, HJT2.0 can reach 25%, 3.0 to 25.5%. Some enterprises in TOPCon claim 24.5% this year, 25% next year, and 25.5% the year after. From a technical point of view, improving efficiency is not achieved by accumulating efficiency on the production line, but by technical design.
EVO 5N Series Bifacial modules combine combining gettering process and single-side μc-Si technology to ensure higher cell efficiency and higher module power. More stable power generation performance and is even better in hot climates. Natural symmetrical bifacial structure brings more energy yield from the backside.
EVO 5N Series Bifacial modules combine combining gettering process and single-side μc-Si technology to ensure higher cell efficiency and higher module power. More stable power generation performance and is even better in hot climates. Natural symmetrical bifacial structure brings more energy yield from the backside.
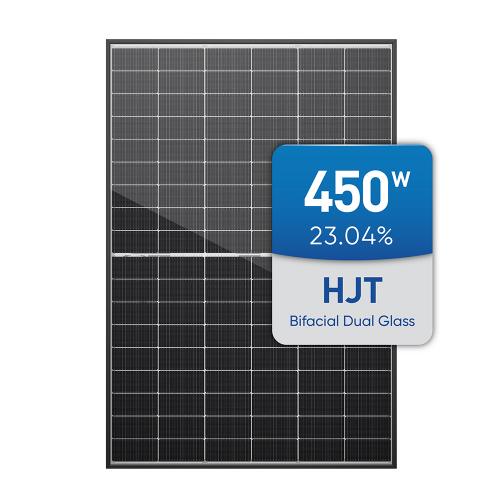
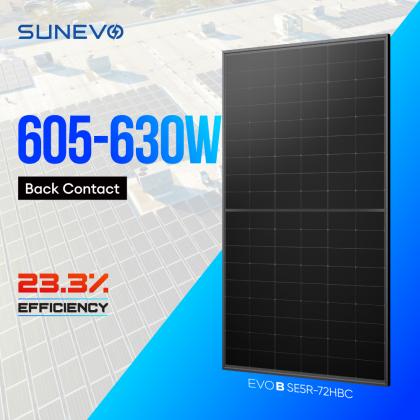
EVO 5N Series HJT Bifacial Dual Glass Black Frame modules combine gettering process and single-side μc-Si technology to ensure higher cell efficiency and higher module power. More stable power generation performance and is even better in hot climates. Stronger water resistance, and greater air impermeability to extend module lifespan.

EVO 5N Series HJT Black Frame modules combine the gettering process and single-side μc-Si technology to ensure higher cell efficiency and higher module power. More stable power generation performance and is even better in hot climates. Stronger water resistance, and greater air impermeability to extend module lifespan.

EVO 5N Series HJT (Heterojunction with Intrinsic Thin-layer) technology combines the advantages of crystalline silicon and thin-film solar cells, resulting in a remarkably high energy conversion efficiency. HJT All-Black panels can harness more sunlight and generate more electricity per square meter.
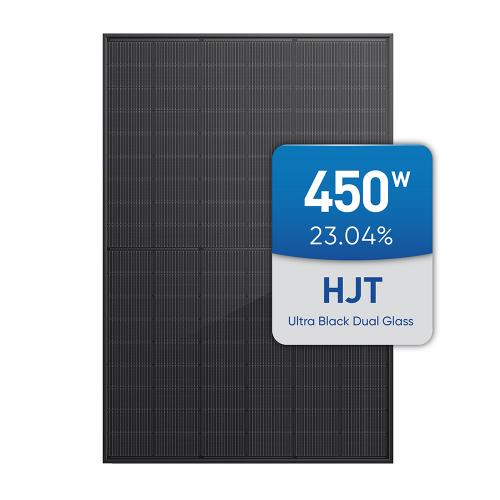
The EVO 5N Series, featuring HJT (Heterojunction with Intrinsic Thin-layer) technology, represents a groundbreaking fusion of the best attributes of both crystalline silicon and thin-film solar cells. The outcome is nothing short of remarkable: a solar technology with exceptional energy conversion efficiency.
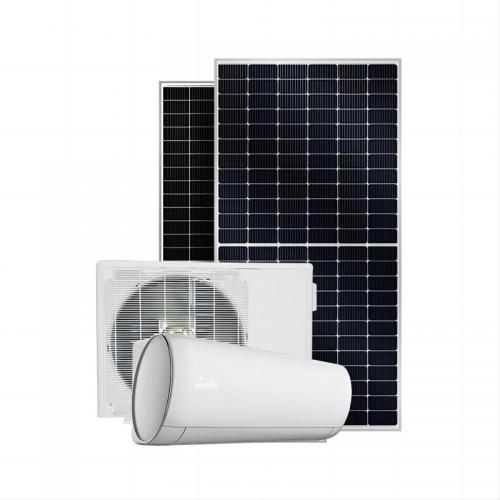
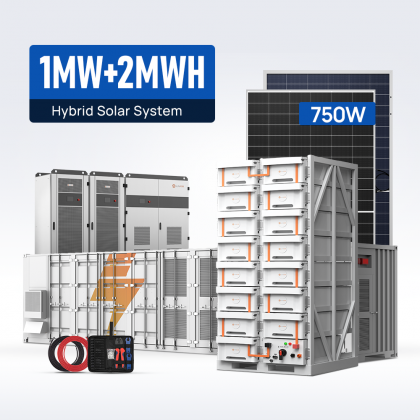
"Solar air conditioner" typically refers to an air conditioning system that utilizes solar energy to power its operation, reducing reliance on conventional electricity sources and potentially offering cost savings and environmental benefits. These systems often integrate solar panels to capture sunlight and convert it into electricity to run the air conditioning unit. Solar air conditioners are becoming increasingly popular as renewable energy technologies advance and as concerns about energy costs and environmental impact grow. They are particularly attractive for locations with abundant sunlight and high cooling demands.
SunArk SunSmart Pro series inverter is a hybrid solar inverter designed for both on-grid and off-grid solar systems, offering flexibility and reliability in various applications. It ranges from 3.6kw to 6.2kw, makes it become very brilliant design for residential solar solutions.


 IPv6 network supported

 français
 Deutsch
 italiano
 español
 português
 العربية
 日本語
日本語 Polski
 ไทย
ไทย